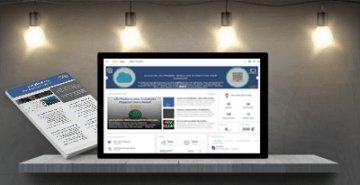
Resource CenterA Marketing Metrics Dashboard: Building a Gadget to Mashup and Display Website Visits and Downloads DataOverviewThe eXo marketing team wanted to be able to view website visit information with daily download statistics in a single view, without having to log into 2 separate sites and manually pull down reports. We solved this problem by building a gadget that can pull data from Google Analytics (visitor statistics) and from a csv file (which contains the download statistics provided by an open source project forge site).
Requirements
Preparation
Getting Data from Google AnalyticsConfiguring oAuthTo be able to access Google Analytics data, you will need a consumer key and consumer secret from Google. To obtain these, go to ManageDomains and follow the steps to add a domain you own. After having verified your site, Google will give you an oAuth Consumer Key and an oAuth Consumer Secret. You can find more information on Registration for Web-Based Applications. To set the keys, you'll need to edit the file oauth.json which is in a jar. To edit it, do the following: mkdir tmp jar xf ../GateIn-3.0.0-GA/lib/exo.portal.gadgets-core-3.0.0-GA.jar Edit the file config/oauth.json and change it to look like the sample below:
{
"http://localhost:8080/rest/jcr/repository/wsrp-system/downloadAnalyticsGagdet/gadget.xml" : {
"google" : {
"consumer_key" : "www.LLL.com",
"consumer_secret" : "YOUR_KEY",
"key_type" : "HMAC_SYMMETRIC"
}
}
}
We re-build our jar and put it back in place: jar cf ../GateIn-3.0.0-GA/lib/exo.portal.gadgets-core-3.0.0-GA.jar * Loading the DataWe can now get the data from Google Analytics in a secure manner. First, in the header of the gadget, we should specify the configuration for Google oAuth:
<ModulePrefs title="Analytics: Pageview - Download">
<OAuth>
<Service name="google">
<Access url="https://www.google.com/accounts/OAuthGetAccessToken" method="GET" />
<Request url="https://www.google.com/accounts/OAuthGetRequestToken?scope=https://www.google.com/analytics/feeds/" method="GET" />
<Authorization url="https://www.google.com/accounts/OAuthAuthorizeToken?oauth_callback=http://oauth.gmodules.com/gadgets/oauthcallback" />
</Service>
</OAuth>
</ModulePrefs>
We will need a small script to help us with the authorization popup: Finally, here is our code for loading the data from Google Analytics.
function getAnalyticsData() {
/*
* Retrieve total pageviews and visits for 30 days.
*/
// The feed URI that is used for retrieving the analytics data
var feedUri = 'https://www.google.com/analytics/feeds/data' +
'?start-date=2010-03-01' +
'&end-date=2010-03-30' +
'&dimensions=ga:date' +
'&metrics=ga:visits,ga:pageviews' +
'&sort=ga:date' +
'&ids=' + analytics_table + '&alt=json',
params = {};
// The response will be in JSON
params[gadgets.io.RequestParameters.CONTENT_TYPE] = gadgets.io.ContentType.JSON;
//The authentication method will be oAuth
params[gadgets.io.RequestParameters.AUTHORIZATION] = gadgets.io.AuthorizationType.OAUTH;
//The name of the oAuth service to authenticate with
params[gadgets.io.RequestParameters.OAUTH_SERVICE_NAME] = "google";
//We want to do a get on the URL
params[gadgets.io.RequestParameters.METHOD] = gadgets.io.MethodType.GET;
//We send the request and define the Callback
gadgets.io.makeRequest(feedUri, function (result) {
//If we need to authentication
if (result.oauthApprovalUrl) {
// Create the popup handler. The onOpen function is called when the user
// opens the popup window. The onClose function is called when the popup
// window is closed.
var popup = shindig.oauth.popup({
destination: result.oauthApprovalUrl,
windowOptions: null,
onOpen: function() {},
onClose: function() {personalize.style.display= "none"; getAnalyticsData(); }
});
var personalize = document.getElementById('personalize');
personalize.onclick = popup.createOpenerOnClick();
document.getElementById('approval').style.display= "block";
} else {
//If the request works, we parse the response and get the data that is interesting for us.
var entries = result.data.feed.entry,
data = [],
entry;
for (var i = 0; i < entries.length; i++) {
entry = entries[i];
data.push(parseFloat(entry["dxp$metric"][0].value));
}
finishLoading("analytics", data);
}
}, params);
}
Getting the Download DataeXo hosts many of its open source projects on the OW2 forge. They provide a csv file with the download counts. Files,,,1,2,3,4,5,6,7,8,9,10,11,12,13,14,15,16,17,18,19,20,21,22,23,24,25,26,27,28,29,30,31,Total ... Total,,,0,0,0,0,0,0,0,0,0,0,0,0,0,0,0,0,0,0,0,0,0,0,0,0,0,0,0,0,0,0,0,0 We will simply load this file and get the last line which is the one that contains the total number of downloads by day.
function getDownloadStats() {
//We do a get on the CSV file
gadgets.io.makeRequest(download_url, function(result) {
//We split the lines
var data = result.data.split("\n"), res = [];
//Take the line before the last one (the last one is empty on our CSV) and split it by comma
data = data[data.length - 2].split(",");
//We get all the data and convert it to Number
for (i = 3; i < data.length - 1; i += 1) {
res.push(parseFloat(data[i]));
}
finishLoading("gss", res);
});
}
Drawing the GraphWe are going to use Raphael.js and g.raphael.js to draw our graph when our data is ready. First we need to include the JavaScript libraries: And our JavaScript code:
function drawChart(datas) {
// we Create The raphael holder
var r = Raphael("holder", 300, 170),
keys = [[], []], values = [[], []],
stars = r.set(),
col = 1,
stars = {};
//g.Raphael wants the data in 2 array //one for the key, the other for the values, so we convert our data to match this format
for (var i = 1; i <=30;i++) {
keys[0].push(i);
keys[1].push(i);
values[0].push(datas["gss"][i - 1]);
values[1].push(datas["analytics"][i - 1]);
}
//We create our chart
var lines = r.g.linechart(0, 0, 300, 150, keys, values, {nostroke: false}).hoverColumn(function () {
this.tags = r.set();
var labels = ["downloads", "visitors"];
//When the mouse is over, we display the values
for (var i = 0, ii = this.y.length; i < ii; i++) {
this.tags.push(r.g.blob(this.x, this.y[i], this.values[i] + " " + labels[i]).insertBefore(this));
}
}, function () {
//We cleanup everything when the mouse is out
this.tags && this.tags.remove();
});
}
Going FurtherWe hard-coded some parameters such as the dates to make the demo simpler. You could easily add a slider to browse the different dates with raphael.js. You could also pull articles from your blog, in order to include other company events in the graph. Extending the marketing dashboard will make it easier to identify patterns and determine the impact of various marketing activities on driving key metrics. Links |
Subscribe to our newsletter and keep up with the latest eXo news and events.